Weekend Market Analysis for June 3, 2006

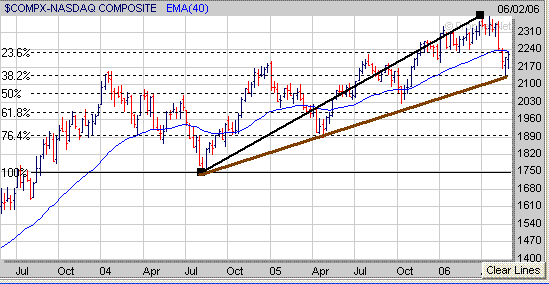
Meanwhile if we look at a longer term chart of the Nasdaq the 2135 level is a critical support area for the Nasdaq as it corresponds to its 38.2% Retracement Level (calculated from the August 2004 low to its most recent high) and also is along its upward sloping trend line (brown line) originating from the August 2004 low. If the Nasdaq were to fall below the 2135 level then its next area of support would either be at its 50% Retracement Level near 2060 or at its October 2005 low near 2030. Thus it will be very important for the Nasdaq to hold support near the 2135 level in the weeks ahead to keep its longer term upward bias intact.
To read our complete Weekend Analysis you can click on the link below.
http://www.amateur-investor.net/Weekend_Market_Analysis_June_3_06.htm

0 Comments:
Post a Comment
<< Home