Weekend Stock Market Analysis for July 1st
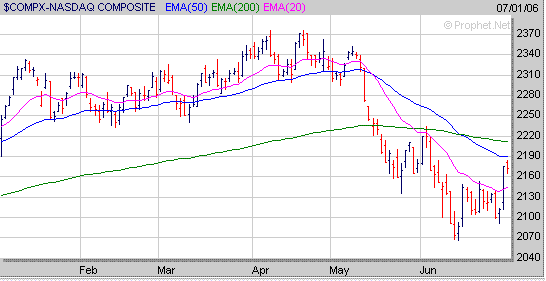
The Nasdaq has rallied over 100 points since making a short term bottom in mid June but has two important upside resistance levels which may come into play over the next few weeks. The first upside resistance area is at the Nasdaq's 50 Day EMA (blue line) near 2190 while the second area is at its 200 Day EMA (green line) near 2210. Thus there is a strong possibility the current oversold rally in the Nasdaq may eventually stall out somewhere in the 2190 to 2210 range either next week or the week after. Meanwhile if the Nasdaq does stall out at its 50 Day EMA around 2190 in the near term and begins to come under some selling pressure look for initial support at its 20 Day EMA (purple line) near 2145.
 To read our complete stock market analysis click on the link below.
http://www.amateur-investor.net/Weekend_Market_Analysis_July_1_06.htm

0 Comments:
Post a Comment
<< Home