Stock Market Analysis for 8/12/06
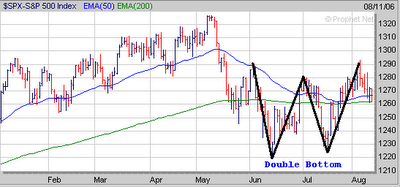
The S&P 500 is exhibiting a potential Double Bottom pattern although the 2nd bottom was not as low as the 1st bottom so it's not a classic Double Bottom pattern from a technical point of view. So far the S&P 500 has held support at its 200 Day EMA (green line) just above 1260 and if it's going to maintain its Double Bottom pattern it will need to continue to do so next week. If the S&P 500 were to break below the 1260 level then it may eventually retest the 1220 to 1225 range which corresponds to the lows made in mid June (1220)and mid July (1225).
 You can read our complete market analysis at
http://www.amateur-investor.net/Weekend_Market_Analysis_Aug_12_06.htm

0 Comments:
Post a Comment
<< Home