Weekly Stock Market Analysis 8/26/06
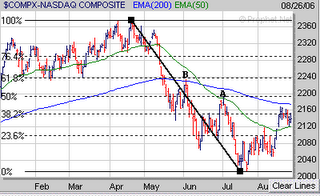
The Nasdaq has developed a trading range between its 200 Day EMA (blue line) near 2175 and its 50 Day EMA (green line) near 2120. We will likely see the Nasdaq break out of this trading range before much longer. If the Nasdaq can rise above its 200 Day EMA near 2175 then I would expect its next area of upside resistance would occur in the 2195 to 2235 range. The 2195 area (point A) corresponds to the Nasdaq's 50% Retracement Level (calculated from the April high to the July low) and is also where it stalled out at in early July. Furthermore the 2235 area (point B) corresponds to the Nasdaq's 61.8% Retracement Level and is also where it stalled out at in early June after attempting to rally from oversold conditions. Meanwhile if the Nasdaq were to break below its 50 Day EMA near 2120 then I would expect to see an eventual retest of the mid July low near 2010.
 You can read our complete market analysis at
http://www.amateur-investor.net/Weekend_Market_Analysis_Aug_26_06.htm

0 Comments:
Post a Comment
<< Home