Weekend Stock Market Analysis (5/20/06)
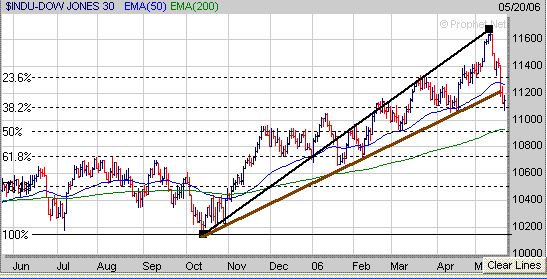
The last week and a half hasn't been pretty as strong selling pressure has occurred in the major averages. The Dow has fallen over 600 points since peaking seven trading days ago near the 11650 level and has broken below its 50 Day EMA (blue line) and upward sloping trend line (brown line) originating from the October 2005 low. At this point one of two things may occur next week in the Dow. If the Dow can hold support at its 38.2% Retracement Level near 11100 then we could see a brief oversold rally develop. However if the Dow is unable to hold support near the 11100 level and continues lower then its next area of support would be around the 10950 area which coincides with its 200 Day EMA (green line) and 50% Retracement Level.
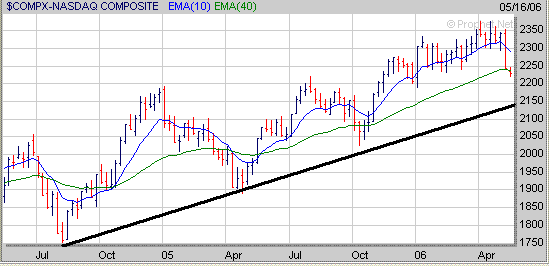
The Nasdaq which topped out five weeks ago near 2375 fell around 200 points during the past seven trading days and is now well below its 40 Weekly EMA (blue line). However despite the Nasdaq getting hammered it still remains above its longer term upward sloping trend line (black line) which originates from the low made in August of 2004. The longer term outlook for the Nasdaq will likely depend on whether it can hold support along its upward sloping trend line or not over the next week or two which appears to be in the 2130-2150 range. If the Nasdaq were to break below its upward sloping term trend line then that could eventually lead to a much larger drop back to its October 2005 low around the 2030 level (point A) at some point.

For our complete Market Analysis you can click on the following link at
http://www.amateur-investor.net/Weekend_Market_Analysis_May_20_06.htm
The Nasdaq which topped out five weeks ago near 2375 fell around 200 points during the past seven trading days and is now well below its 40 Weekly EMA (blue line). However despite the Nasdaq getting hammered it still remains above its longer term upward sloping trend line (black line) which originates from the low made in August of 2004. The longer term outlook for the Nasdaq will likely depend on whether it can hold support along its upward sloping trend line or not over the next week or two which appears to be in the 2130-2150 range. If the Nasdaq were to break below its upward sloping term trend line then that could eventually lead to a much larger drop back to its October 2005 low around the 2030 level (point A) at some point.

For our complete Market Analysis you can click on the following link at
http://www.amateur-investor.net/Weekend_Market_Analysis_May_20_06.htm


