Saturday, June 24, 2006

Weekend Market Analysis for 6/24/06

Next week we have a Federal Reserve meeting and also it will be the end of the 2nd Quarter so I expect we will see an increase in daily volatility starting next Wednesday which will continue through Friday.

The Nasdaq has been in a short term trading range after the big move upward seven trading days ago and has encountered resistance at its 20 day EMA (blue line) near 2145 while finding support just above the 2100 level. Next week I would look for one of two things to occur. If the Nasdaq can rise above the 2145 level then it may quickly rally back to either its 50 Day EMA (green line) near 2200 or its 200 Day EMA (purple line) just below the 2220 level. Meanwhile if the Nasdaq breaks below the 2100 level the look for it to retest the low made a few weeks ago near 2065.


To read our complete Market Analysis for this week click on the link below.

http://www.amateur-investor.net/AII_Weekend_AnalysisJune_24_06.htm
Saturday, June 17, 2006

Weekend Stock market Analysis for June 17th

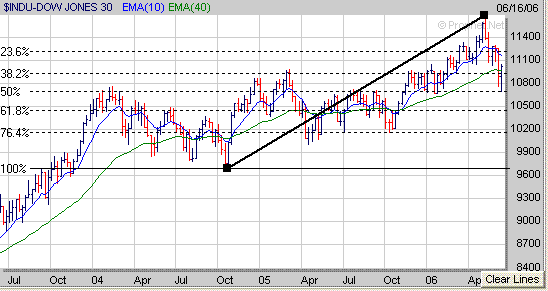
After nearly six weeks of selling we finally got a decent bounce this week which began on Wednesday as the market had become very oversold. A longer term weekly chart of the Dow shows that at least in the near term it has found support at its 50% Retracement Level (calculated from the October 2004 low to the May 2006 high) near 10700. Now the question is can the Dow follow through to the upside over the next few weeks or will this latest bounce from oversold conditions fizzle out and eventually lead to more selling pressure.


To read our complete market analysis for this week click on the link below.

http://www.amateur-investor.net/Weekend_Market_Analysis_June_17_06.htm

Saturday, June 10, 2006

Weekend Stock Market Analysis for June 10th

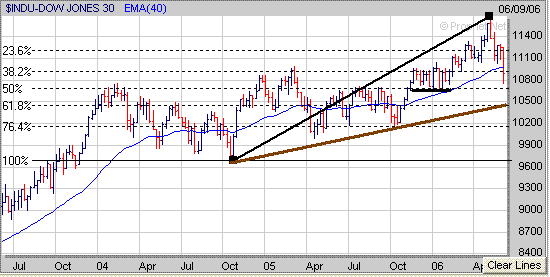
The major averages have been in a correction during the past five weeks. The Dow has dropped around 900 points or 7.8% since peaking in early May and failed to hold support at its 40 Weekly EMA (blue line) this week. If the Dow remains under more selling pressure the next area of support appears to be at its 50% Retracement Level (calculated from the October 2004 low to its most recent high) near 10700. The 10700 level is also where the Dow found support at in the late part of 2005 into the early part of 2006 as well. If the Dow fails to hold support at the 10700 level then the next downside support area would be just below 10500 which corresponds to its 61.8% Retracement Level and upward sloping trend line (brown line) originating from the October 2004 low.

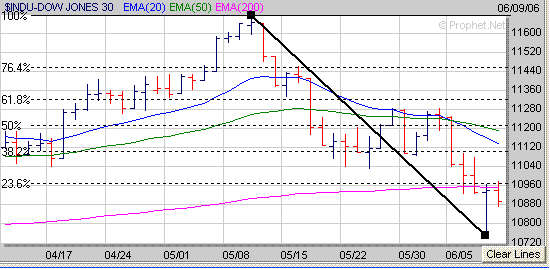
Meanwhile if the Dow attempts to bounce from oversold conditions next week look for its first level of resistance in the 11000 to 11200 range. The 11000 area is where the Dow's falling 20 Day EMA (blue line) is nearing and is also where the 38.2% Retracement Level (calculated from the early May high to the most recent low) is close to as well. Meanwhile the 11200 area is where the Dow's 50 Day EMA (green line) resides at and is also near its 50% Retracement Level.


To read our complete Weekly Market Analysis Report click on the link below.

http://www.amateur-investor.net/AII_Weekend_AnalysisJune_10_06.htm

Saturday, June 03, 2006

Weekend Market Analysis for June 3, 2006

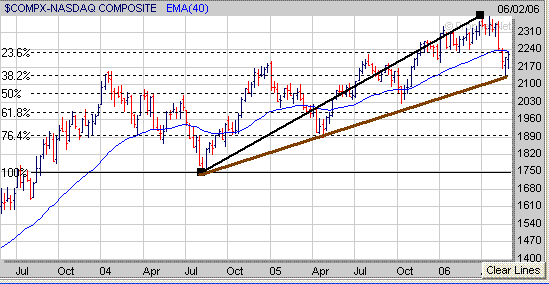
The Nasdaq has rallied just over 100 points since making a short term bottom seven trading days ago and has risen back to its 200 Day EMA (green line) near 2230. At this point one of two things may occur with the Nasdaq in the short term. The first scenario would be for the Nasdaq to rise above its 200 Day EMA leading to a move up to its 50 Day EMA (blue line) near 2260 which is its next level of resistance above 2230. Meanwhile the second scenario would be for the Nasdaq to stall out near its 200 Day EMA and then come under more selling pressure leading to an eventual retest of its low made just over a week ago near 2135.


Meanwhile if we look at a longer term chart of the Nasdaq the 2135 level is a critical support area for the Nasdaq as it corresponds to its 38.2% Retracement Level (calculated from the August 2004 low to its most recent high) and also is along its upward sloping trend line (brown line) originating from the August 2004 low. If the Nasdaq were to fall below the 2135 level then its next area of support would either be at its 50% Retracement Level near 2060 or at its October 2005 low near 2030. Thus it will be very important for the Nasdaq to hold support near the 2135 level in the weeks ahead to keep its longer term upward bias intact.


To read our complete Weekend Analysis you can click on the link below.

http://www.amateur-investor.net/Weekend_Market_Analysis_June_3_06.htm