Weekend Market Analysis for July 29th
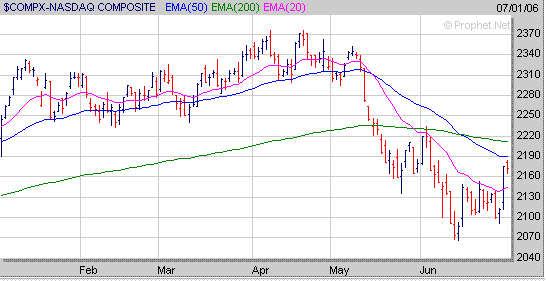
Since early May the Nasdaq has been making a series of lower lows (points L) as it has remained in a steady downtrend. Also you may notice that the previous two bounces from oversold conditions ended up stalling either at the Nasdaq's 50 Day EMA (blue line) or 200 Day EMA (green line). If the Nasdaq is able to rally back to its 50 Day EMA which is currently near 2130 it will be interesting to see what happens this time around as there are two possibilities. Either the Nasdaq will stall out at its 50 Day EMA and then come under more selling pressure with an eventual retest of its low made just a few weeks ago near 2010 or it will rise above its 50 Day EMA leading to a move up to its 200 Day EMA near 2190.

You can read our complete market analysis for July 29th at
http://www.amateur-investors.com/Weekend_Market_Analysis_July_29_06.htm

You can read our complete market analysis for July 29th at
http://www.amateur-investors.com/Weekend_Market_Analysis_July_29_06.htm


